Subspace Clustering - 用稀疏子空间聚类做运动分割
用子空间聚类算法来做运动分割,其中稀疏表示和低秩表示聚类比较多。
State-of-art 方法:
SSC (Sparse Subspace Clustering)
- E. Elhamifar, R. Vidal, “Sparse Subspace Clustering: Algorithm, Theory, and Applications,” IEEE Transactions on Pattern Analysis and Machine Intelligence, vol. 35, no. 11, pp. 2765-2781, Nov., 2013
- Vidal, R., “Subspace Clustering,” Signal Processing Magazine, IEEE , vol.28, no.2, pp.52,68, March 2011
LRR (Low-Rank Representation)
- Guangcan Liu; Zhouchen Lin; Shuicheng Yan; Ju Sun; Yong Yu; Yi Ma, “Robust Recovery of Subspace Structures by Low-Rank Representation,” Pattern Analysis and Machine Intelligence, IEEE Transactions on , vol.35, no.1, pp.171,184, Jan. 2013
- Bin Cheng; Guangcan Liu; Jingdong Wang; Zhongyang Huang; Shuicheng Yan, “Multi-task low-rank affinity pursuit for image segmentation,” Computer Vision (ICCV), 2011 IEEE International Conference on , vol., no., pp.2439,2446, 6-13 Nov. 2011
刚性的 motion segmentation 基本上用 subspace clustering 解决,效果就挺好了。因为同一个刚性目标基本上可以看成是采样在同一个子空间中。如果是非刚性的话可能效果就不是特别好。
RSSC (Reweighted Sparse Subspace Clustering)
- Jun Xu, Kui Xu, Ke Chen, Jishou Ruan, Reweighted sparse subspace clustering, Computer Vision and Image Understanding, Available online 21 April 2015, ISSN 1077-3142
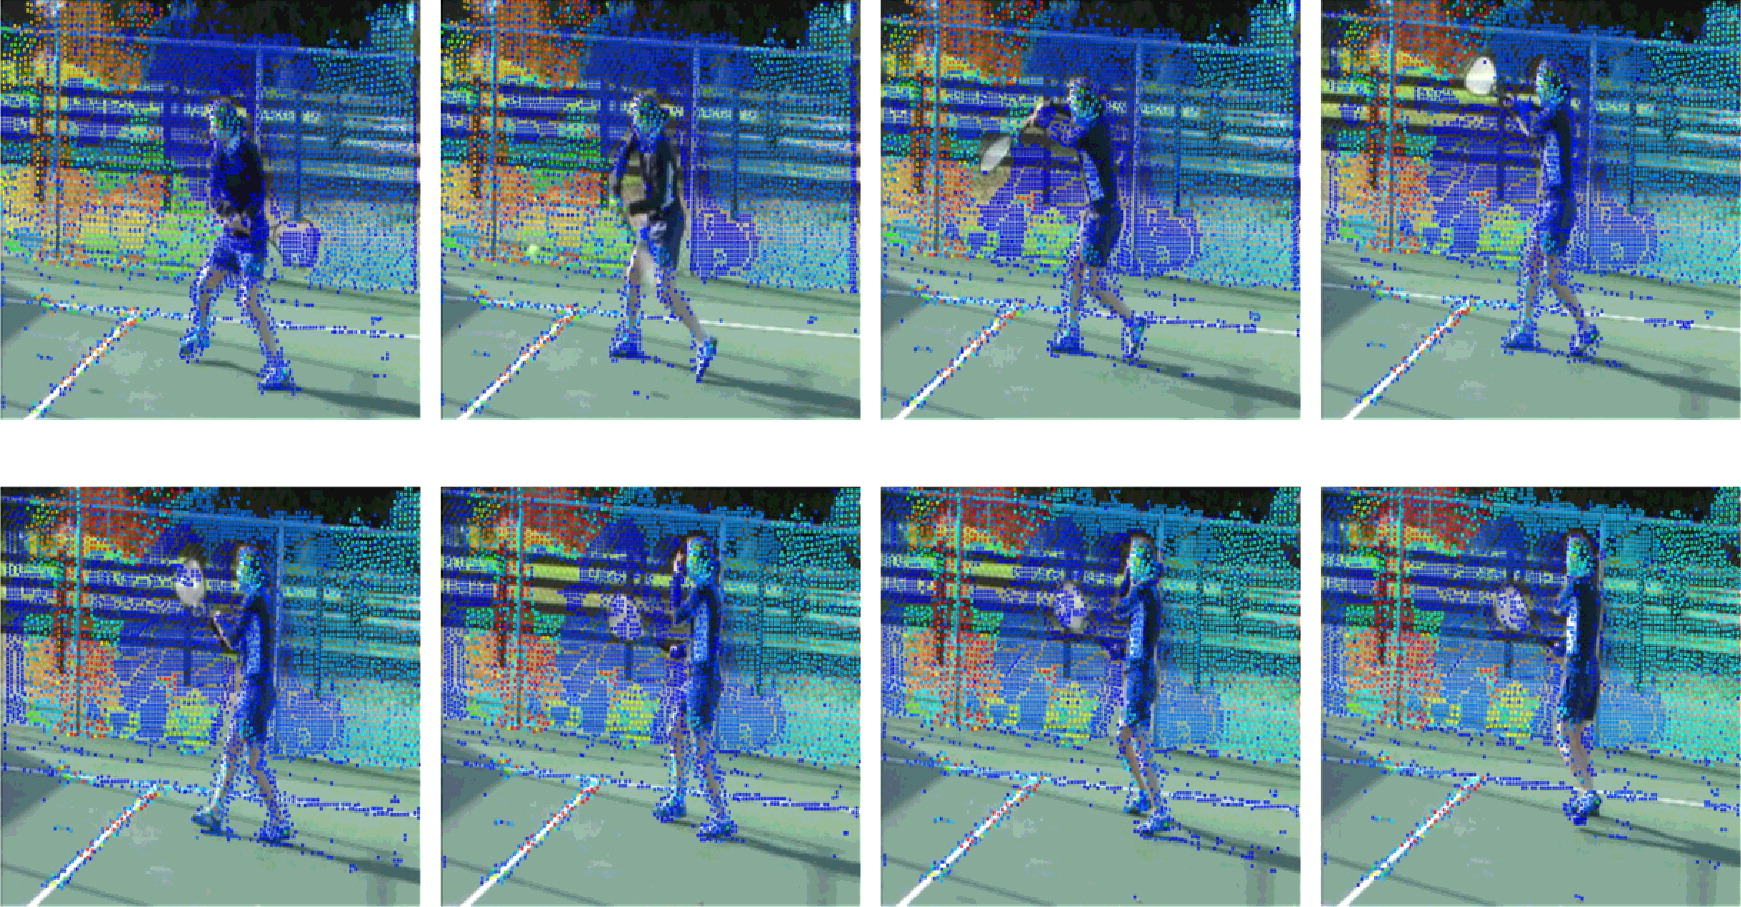
非刚性的 motion segmentation
Table 1. Clustering error (%) of the state-of-the-art algorithms and our proposed RSSC algorithm on the Hopkins 155 dataset with the 2F-dimensional data points. The lowest mean and median clustering errors are highlighted in bold.
| No. of motion | Algorithm | LSR1 | LSR2 | SMR | LRR | SSC | RSSC |
|---|---|---|---|---|---|---|---|
| 2 Motions | Mean | 2.16 | 2.47 | 0.88 | 2.13 | 1.53 | 0.64 |
| (120 seqs) | Median | 0.11 | 0.001 | 0.00 | 0.00 | 0.00 | 0.00 |
| 3 Motions | Mean | 5.76 | 6.23 | 1.92 | 4.03 | 4.40 | 2.01 |
| (35 seqs) | Median | 1.60 | 1.63 | 0.58 | 1.43 | 0.56 | 0.56 |
| All | Mean | 2.97 | 3.32 | 1.12 | 2.56 | 2.18 | 0.95 |
| (155 seqs) | Median | 0.28 | 0.28 | 0.00 | 0.00 | 0.00 | 0.00 |
Table 2. Clustering error (%) of the state-of-the-art algorithms and our proposed RSSC algorithm on the Hopkins 155 dataset with the 4n-dimensional data points obtained by applying PCA. The lowest mean and median clustering errors are highlighted in bold.
| No. of motion | Algorithm | LSR1 | LSR2 | SMR | LRR | SSC | RSSC |
|---|---|---|---|---|---|---|---|
| 2 Motions | Mean | 2.46 | 2.73 | 1.04 | 3.64 | 1.69 | 0.83 |
| (120 seqs) | Median | 0.22 | 0.22 | 0.00 | 0.00 | 0.00 | 0.00 |
| 3 Motions | Mean | 5.77 | 6.21 | 1.96 | 4.17 | 4.38 | 2.50 |
| (35 seqs) | Median | 1.60 | 1.83 | 0.58 | 1.43 | 0.56 | 0.37 |
| All | Mean | 3.20 | 3.52 | 1.25 | 3.76 | 2.29 | 1.21 |
| (155 seqs) | Median | 0.37 | 0.37 | 0.00 | 0.00 | 0.00 | 0.00 |
Table 3. The comparement of computation time (s) of different algorithms on Hopkins155 dataset with the 2F-dimensional data points. The computation time is recorded in two stages. One is the average computation time of solving the representation or affinity matrix (Repres.), the other is the average computation time of the spectral clustering stage (Spectr.). The lowest time for solving the representation matrix are highlighted in bold.
| No. of motion | Algorithm | LSR1 | LSR2 | SMR | LRR | SSC | RSSC |
|---|---|---|---|---|---|---|---|
| 2 Motions | Repres. | 0.006 | 0.003 | 0.108 | 0.865 | 0.465 | 0.813 |
| (120 seqs) | Spectr. | 0.019 | 0.021 | 0.093 | 0.049 | 0.053 | 0.047 |
| 3 Motions | Repre. | 0.013 | 0.008 | 0.256 | 1.214 | 0.968 | 1.740 |
| (35 seqs) | Spectr. | 0.036 | 0.039 | 0.162 | 0.096 | 0.098 | 0.094 |
Table 5. Clustering error (%) of the state-of-the-art algorithms and our proposed RSSC algorithm on the Freiburg-Berkeley Motion Segmentation dataset with the 2F-dimensional data points. The dataset is divided into two parts: rigid motions and non-rigid motions. The lowest mean and median clustering errors are highlighted in bold.
| Type of motion | Algorithm | LSR1 | LSR2 | LSA | SCC | SMR | LRR | SSC | RSSC |
|---|---|---|---|---|---|---|---|---|---|
| Rigid | Mean | 0.59 | 0.59 | 5.4 | 2.56 | 1.44 | 3.14 | 1.31 | 1.2 |
| (22 seqs) | Median | 0 | 0 | 0 | 0 | 0 | 0 | 0 | 0 |
| Non-rigid | Mean | 7.88 | 7.87 | 18.01 | 7.22 | 11.09 | 10.97 | 8.61 | 7.45 |
| (115 seqs) | Median | 0.38 | 0.38 | 12 | 0.5 | 3.25 | 0 | 0 | 0 |
| All | Mean | 6.71 | 6.7 | 15.98 | 6.47 | 9.54 | 9.72 | 7.45 | 6.44 |
| (137 seqs) | Median | 0 | 0 | 8.25 | 0.25 | 1 | 0 | 0 | 0 |
Table 6. Clustering error (%) of the state-of-the-art algorithms and our proposed RSSC algorithm on the Freiburg-Berkeley Motion Segmentation dataset with the 4n-dimensional data points obtained by applying PCA. The dataset is divided into two parts: rigid motions and non-rigid motions. The lowest mean and median clustering errors are highlighted in bold.
| Type of motion | Algorithm | LSR1 | LSR2 | LSA | SCC | SMR | LRR | SSC | RSSC |
|---|---|---|---|---|---|---|---|---|---|
| Rigid | Mean | 0.57 | 0.57 | 5.4 | 2.5 | 1.44 | 3.09 | 1.31 | 1.24 |
| (22 seqs) | Median | 0 | 0 | 0 | 0 | 0 | 0 | 0 | 0 |
| Non-rigid | Mean | 7.59 | 7.6 | 16.98 | 7.29 | 12.07 | 10.53 | 8.78 | 6.68 |
| (115 seqs) | Median | 0.36 | 0.36 | 9.5 | 0.5 | 3.89 | 0.25 | 0 | 0 |
| All | Mean | 6.47 | 6.47 | 16.05 | 6.52 | 10.37 | 9.34 | 7.58 | 5.81 |
| (137 seqs) | Median | 0 | 0 | 8.5 | 0.25 | 1.75 | 0 | 0 | 0 |
Table 9. Clustering error (%) of our algorithm and the SSC algorithm on the Extended Yale B dataset. The lowest mean and median clustering errors are highlighted in bold.
| No. of subject | Algorithm | LSR1 | LSR2 | SMR | LRR | SSC | RSSC |
|---|---|---|---|---|---|---|---|
| 2 Subjects | Mean | 7.34 | 7.35 | 1.75 | 2.13 | 1.85 | 0.57 |
| (163 combinations) | Median | 7.03 | 7.03 | 0.78 | 0.78 | 0 | 0 |
| 3 Subjects | Mean | 10.06 | 9.92 | 3.03 | 3.5 | 3.3 | 1.09 |
| (416 combinations) | Median | 10.42 | 10.42 | 2.08 | 2.08 | 1.04 | 0 |
| 4 Subjects | Mean | 13.96 | 13.66 | 3.25 | 4.86 | 3.81 | 1.65 |
| (700 combinations) | Median | 14.45 | 14.06 | 2.34 | 3.91 | 1.95 | 0.39 |
| 5 Subjects | Mean | 17.99 | 17.57 | 3.91 | 5.91 | 4.33 | 2.21 |
| (812 combinations) | Median | 18.13 | 17.81 | 2.5 | 5 | 2.81 | 0.62 |
| 6 Subjects | Mean | 21.57 | 20.95 | 5.28 | 6.83 | 4.83 | 2.79 |
| (658 combinations) | Median | 21.61 | 21.09 | 2.86 | 5.99 | 3.39 | 1.3 |
| 7 Subjects | Mean | 25.15 | 24.32 | 6.38 | 7.75 | 5.42 | 3.43 |
| (368 combinations) | Median | 25 | 24.11 | 3.13 | 7.14 | 4.46 | 1.79 |
| 8 Subjects | Mean | 28.91 | 27.52 | 6.83 | 11.05 | 5.88 | 3.97 |
| (136 combinations) | Median | 29.69 | 27.83 | 3.71 | 7.42 | 4.49 | 1.86 |
| 9 Subjects | Mean | 32.37 | 31 | 7.14 | 10.32 | 6.44 | 4.57 |
| (30 combinations) | Median | 32.73 | 31.42 | 4.51 | 7.81 | 4.95 | 2.69 |
| 10 Subjects | Mean | 36.46 | 33.49 | 7.81 | 16.93 | 7.24 | 4.79 |
| (3 combinations) | Median | 36.09 | 32.81 | 7.03 | 18.91 | 5.47 | 3.28 |


